
AR Billboards: Tracking Engagement and Conversion Metrics
In the rapidly evolving digital advertising landscape, Augmented Reality (AR) billboards are emerging as powerful tools for brands seeking to create immersive and interactive experiences. Unlike traditional static billboards, AR-enhanced advertisements offer unprecedented opportunities for engagement, data collection, and performance analysis. This article explores how marketers can effectively track engagement and conversion metrics for AR billboard campaigns, providing actionable insights for optimizing return on investment.
Understanding AR Billboards
AR billboards blend the physical and digital worlds by overlaying computer-generated content onto real-world environments. The content is viewable through smartphones, tablets, AR glasses, or specialized displays. These next-generation advertising platforms transform passive viewing experiences into interactive encounters, allowing consumers to engage with brands in meaningful ways.
How AR Billboards Work
AR billboards typically operate through one of several mechanisms:
- Marker-based AR: Using QR codes or visual triggers that, when scanned with an AR-enabled device, launch interactive experiences.
- Location-based AR: Utilizing GPS coordinates to display virtual content when users are in specific geographic locations.
- Surface detection: Leveraging camera technology to identify flat surfaces where virtual objects can be realistically placed.
- Web AR: Browser-based experiences that don't require dedicated app downloads, reducing friction in the user journey.
Key Metrics for AR Billboard Campaigns
To understand the true impact of AR billboard initiatives, marketers must track specific metrics that capture the unique aspects of augmented reality experiences. Based on the latest XR analytics frameworks, these metrics provide comprehensive insights into campaign performance.
Awareness and Reach Metrics
Impressions
Impressions measure how many times your AR billboard content is displayed, regardless of interaction. For AR campaigns, impressions can be categorized as:
- Potential impressions: The number of people who pass by the physical trigger point
- AR trigger views: How many people saw the AR activation prompt
- App-based impressions: When using a dedicated app, how many times the AR feature was available to users
Tracking impressions helps establish the top-of-funnel reach of your campaign and serves as the denominator for calculating engagement rates.
Opens
The "opens" metric represents the number of times users activate the AR experience, which typically requires deliberate action like scanning a QR code or tapping a button. This metric is crucial as it indicates the effectiveness of your call-to-action and the appeal of your AR concept. A high impressions-to-opens ratio suggests strong initial interest in your campaign.
Engagement Metrics
Average Session Length
One of AR's most valuable metrics is session duration. While traditional billboards may capture attention for mere seconds, compelling AR experiences can engage users for minutes. Longer sessions indicate higher quality engagement and provide more opportunities for brand messaging to resonate.
Industry benchmarks suggest that successful AR billboard campaigns achieve average session lengths of 45-75 seconds, significantly outperforming traditional digital advertising formats.
Captures
The "captures" metric tracks how many users save or capture content from the AR experience. This might include:
- Screenshots of the AR experience
- Videos recorded while using the AR feature
- 3D models or AR filters saved to the user's device
Captures represent a deeper level of engagement than mere viewing and often signal content that users find valuable enough to preserve.
Engagement Interactions
Detailed interaction metrics provide insights into how users engage with specific elements of your AR experience:
- Tap/click events: How users interact with clickable elements
- Object manipulation: Tracking when users resize, rotate, or reposition AR elements
- Feature utilization: Which AR features receive the most attention
- Progression rates: How many users complete multi-step AR experiences
These granular metrics help you identify which aspects of your AR billboard resonate most with audiences, which will inform future design decisions.
Visual Attention Heatmaps
Advanced AR analytics platforms can generate visual attention heatmaps showing precisely where users focus their attention during the AR experience. These heatmaps reveal:
- Which elements capture immediate attention
- How attention shifts throughout the experience
- Areas that receive minimal engagement
- Optimal placement for key messaging and calls-to-action
Visual attention analysis helps optimize the design of AR experiences to ensure important brand messages receive maximum exposure.
Social and Sharing Metrics
Social Shares
AR billboards have a natural advantage in shareability compared to traditional advertising. Tracking social shares provides insight into how many users find your AR experience compelling enough to share with their networks. This metric encompasses:
- Direct shares from the AR application
- Screenshots or recordings shared to social platforms
- Mentions and hashtags related to your AR campaign
High share rates amplify your campaign's reach and serve as powerful social proof, potentially generating earned media beyond your paid advertising investment.
Audience Insights
Demographics
AR platforms can collect rich demographic data about users who engage with your experiences, including:
- Age ranges
- Gender distribution
- Geographic location
- Device types
- Language preferences
This demographic information helps refine audience targeting for future campaigns and provides valuable insights into which audience segments respond most positively to AR advertising.
Conversion Metrics
Brand Awareness Lift
Measuring changes in brand awareness requires pre- and post-campaign surveys or brand tracking studies. Key indicators include:
- Brand recall improvements
- Changes in brand perception
- Increased brand consideration
- Message association
AR experiences typically generate stronger brand recall than traditional media due to their interactive and immersive nature, with studies showing 70-80% message retention compared to 10-20% for standard advertising.
Conversions
The ultimate metric for many campaigns is conversion rate – the percentage of users who complete desired actions after engaging with your AR billboard. These actions might include:
- App downloads
- Newsletter signups
- Online purchases
- Store visits
- Coupon redemptions
- Product trial requests
AR campaigns excel at driving specific consumer behaviors when designed with clear conversion pathways and compelling calls-to-action.
Implementing Effective Tracking Systems
Technical Implementation
To accurately measure AR billboard performance, marketers need robust tracking systems:
- SDK Integration: Most AR development platforms offer analytics SDKs that can be integrated into custom AR experiences.
- Third-Party Analytics: Tools like Google Analytics, Firebase, or specialized XR analytics platforms can provide comprehensive measurement capabilities.
- Custom Event Tracking: Implement custom event tracking to capture specific interactions unique to your AR experience.
- Cross-Platform Attribution: Connect AR engagement data with other marketing platforms to understand the complete customer journey.
Privacy Considerations
As with all digital marketing, privacy regulations impact how AR data can be collected and utilized:
- Obtain appropriate user consent before collecting data
- Anonymize data where possible to protect user privacy
- Be transparent about what data is collected and how it's used
- Provide clear opt-out mechanisms for users
- Comply with regional regulations like GDPR, CCPA, and emerging XR-specific privacy frameworks
Case Studies: AR Billboard Success Stories
Automotive Brand AR Visualization
An automotive manufacturer implemented an AR billboard campaign allowing passersby to visualize different car models in their preferred colors. The campaign tracked:
- 56,000 AR activations over a four-week period
- Average engagement time of 2.3 minutes
- 32% of users captured and shared their AR experience
- 27% increase in dealership visits attributed to AR engagement
The visual attention heatmaps revealed that users spent the most time examining the interior features and customization options, leading to refined messaging in subsequent campaigns.
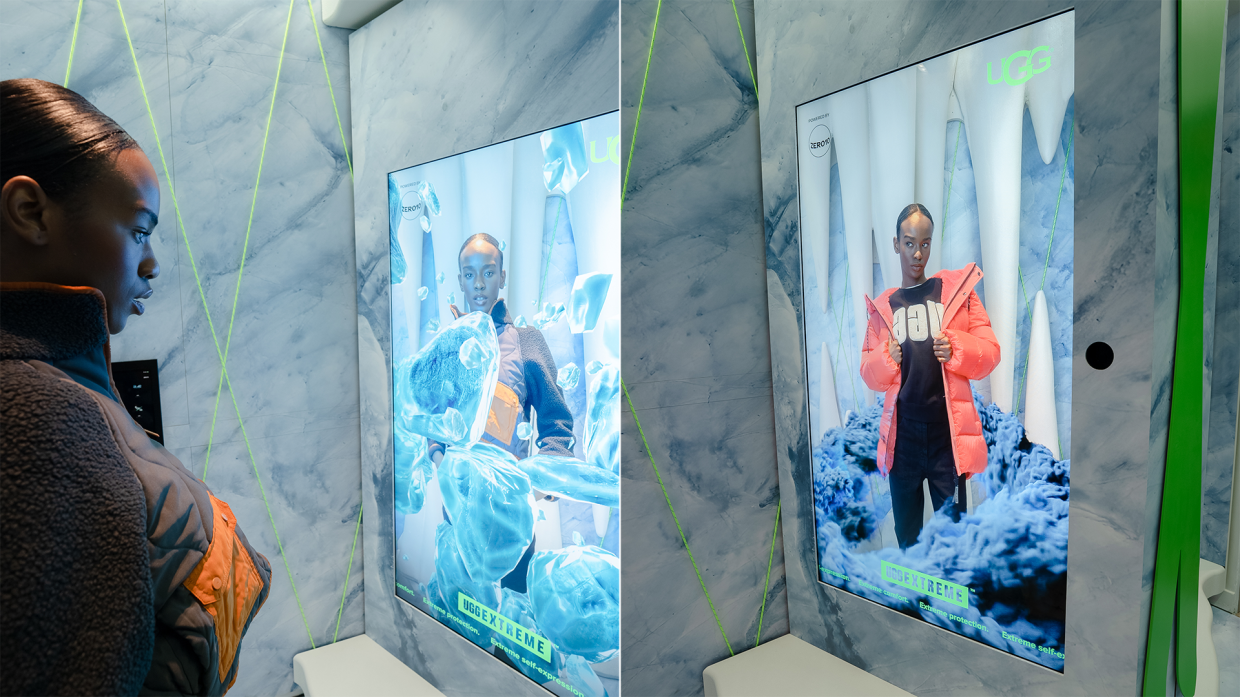
Retail Fashion AR Try-On
A fashion retailer's AR billboard campaign enabled virtual try-on experiences from street-level advertisements. Key metrics showed:
- 78% of users who activated the AR experience explored multiple products
- 42% average conversion rate to online browsing sessions
- 18% conversion to purchase among AR users (versus 3% from traditional digital ads)
- Social sharing generated an estimated 2.3 million earned impressions
Demographics data revealed unexpectedly strong engagement from older age groups (45-60), prompting the brand to reconsider their target audience for AR campaigns.
Best Practices for AR Billboard Metric Analysis
Benchmarking and Contextualizing Data
Raw numbers alone provide limited value. Effective AR metric analysis requires:
- Industry benchmarks: Compare your metrics against similar AR campaigns in your industry
- Historical performance: Track improvements across multiple AR initiatives
- Cross-channel comparisons: Understand how AR performance relates to other advertising channels
- ROI calculations: Develop models that translate engagement metrics into business value
A/B Testing for Optimization
AR billboard campaigns benefit significantly from systematic testing:
- Test different calls-to-action for increasing activation rates
- Compare various AR interactions to maximize engagement
- Experiment with different conversion paths
- Test placement and timing variables
Continuous optimization based on performance data allows marketers to refine AR experiences for maximum impact.
The Future of AR Billboard Metrics
As AR technology evolves, new measurement capabilities are emerging:
Biometric Measurements
Advanced AR systems can potentially capture:
- Eye tracking data with unprecedented precision
- Emotional responses through facial expression analysis
- Physiological indicators of engagement and excitement
Cross-Reality Attribution
As consumers engage across multiple reality platforms (AR, VR, MR), sophisticated attribution models will track customer journeys that span different immersive experiences and traditional channels.
Real-Time Optimization
Machine learning algorithms will increasingly enable real-time adaptation of AR experiences based on performance metrics, creating dynamically optimized campaigns that respond to user behavior patterns.
Conclusion
AR billboards represent a significant advancement in out-of-home advertising, offering unprecedented opportunities for engagement, data collection, and performance measurement. By implementing comprehensive tracking for impressions, opens, engagement metrics, social sharing, demographics, and conversions, marketers can quantify the impact of AR campaigns and continuously refine their approach.
As AR technology becomes more mainstream and measurement capabilities grow more sophisticated, brands that master these metrics will gain significant competitive advantages in the evolving advertising landscape. The future belongs to marketers who can not only create compelling AR experiences but also effectively measure their impact on consumer behavior and brand perception.
By embracing the unique metrics offered by AR billboards, advertisers can move beyond impression-based marketing to create truly accountable immersive advertising campaigns that deliver measurable business results.
TALK TO A PRO
We're here to bring your brand to life!
Stay Connected with BrandXR
Create Augmented Reality for Free!
Create, Publish, and Measure 3D Augmented Reality Experiences Without Having to Code.