
Instagram, FaceBook, Snapchat TikTok Filters


2D/3D Art & Animation Production

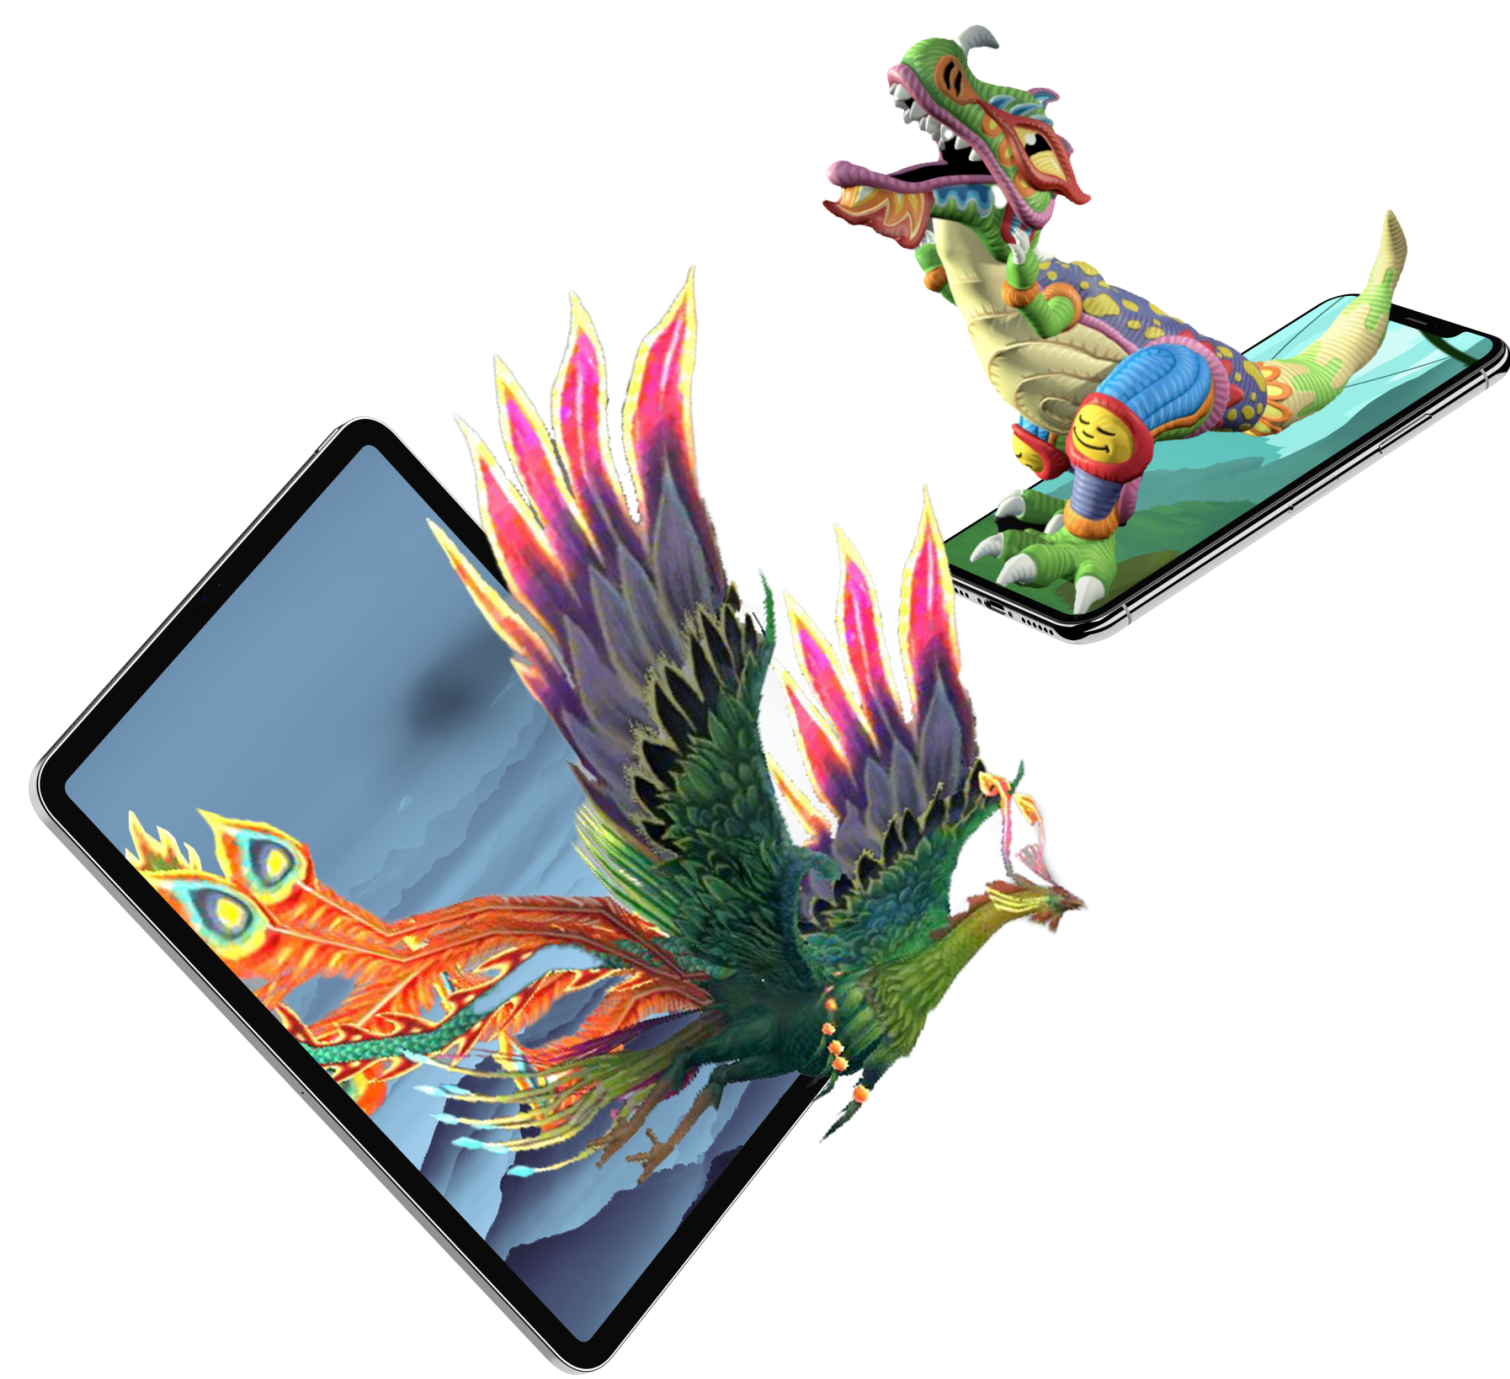
3D Product Visuals & Digital Twins

Custom Android & iOS Apps

Creative as a Service & Metaverse Strategy Consulting

Custom Programming & Feature Development

Blog
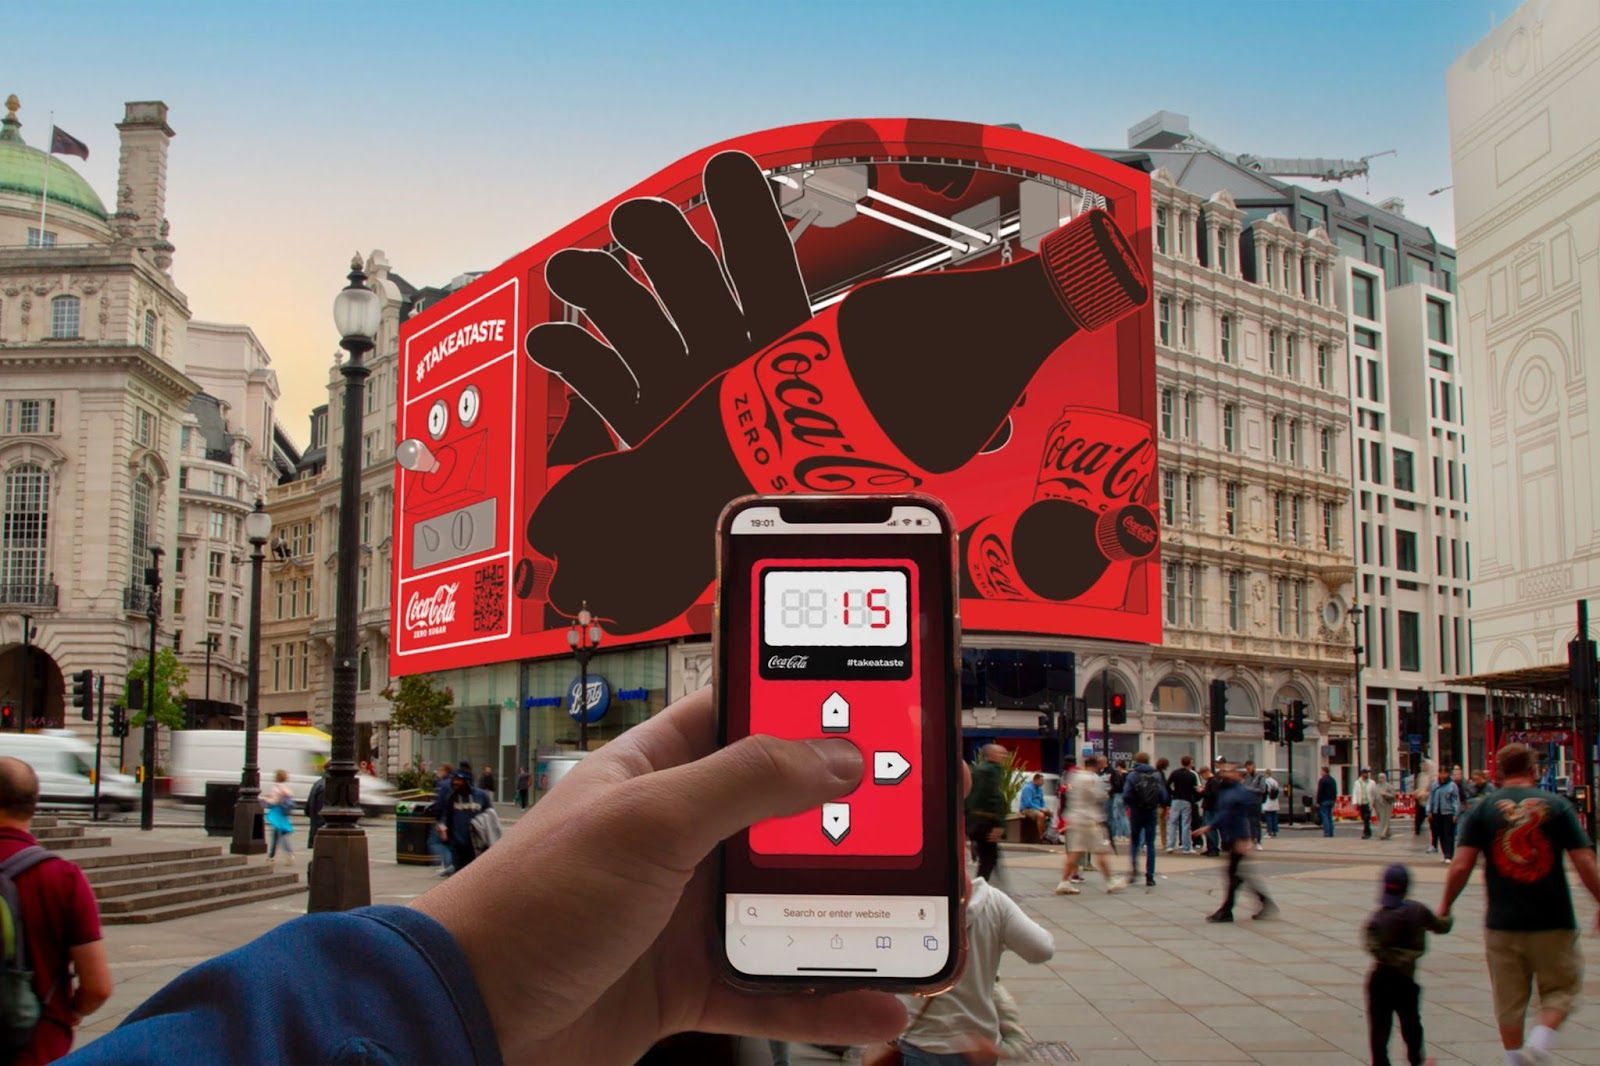
Discover which billboard format delivers better AR campaign results. Expert analysis of static vs digital OOH for augmented reality advertising success.
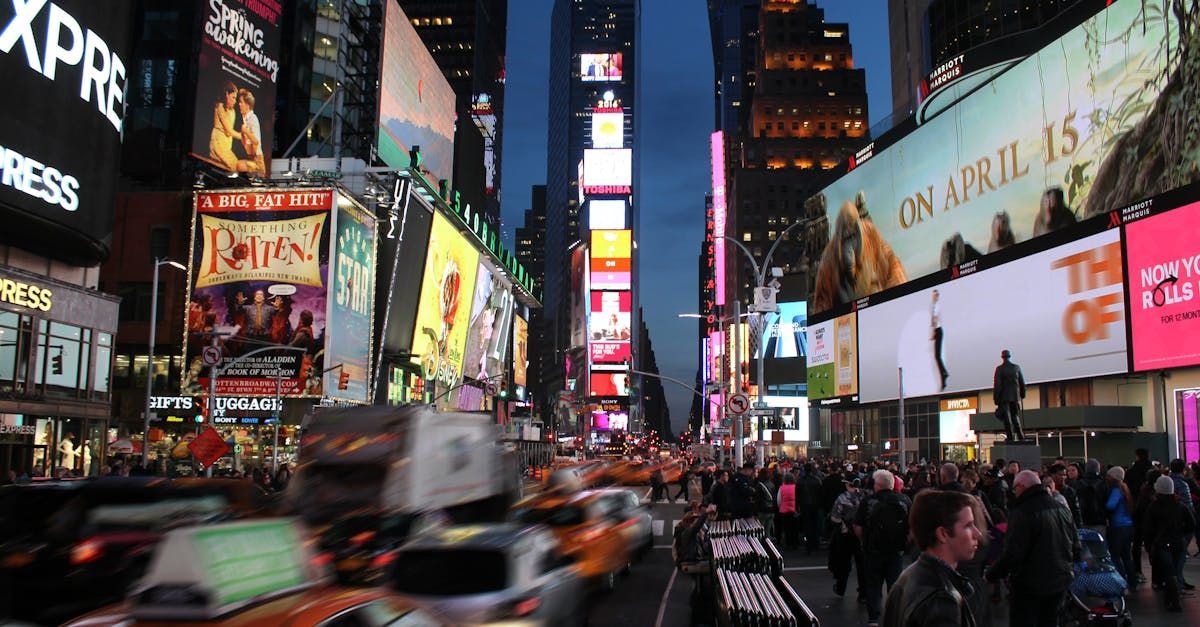
Discover AR billboard pricing in 2025 and why augmented reality is transforming OOH advertising. Learn cost factors, pricing tiers, timelines, and ROI compared to $250K anamorphic billboards — plus FAQs on AR campaign setup and best practices.
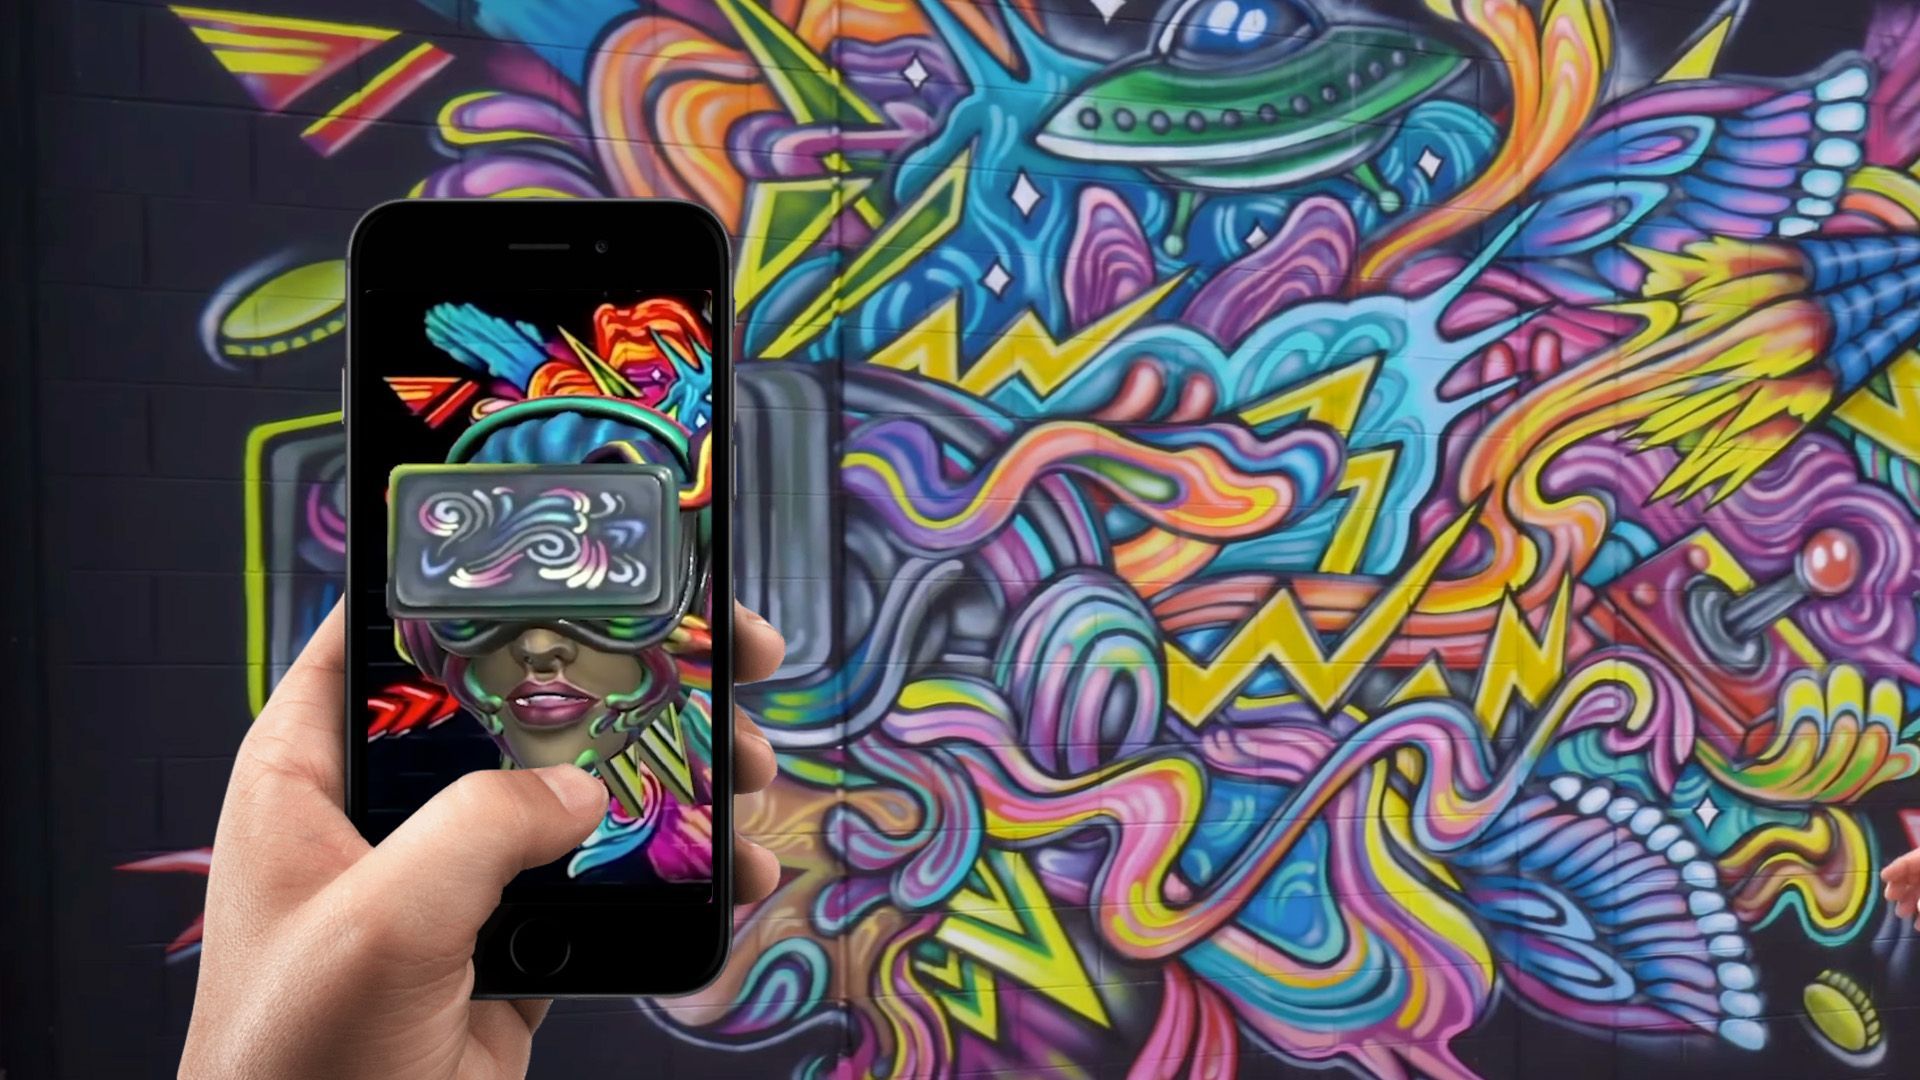
Discover how to create Augmented Reality Murals that captivate audiences and drive brand engagement. Learn the benefits, process, and case studies from BrandXR—the pioneers of interactive murals, immersive murals, and augmented reality outdoor advertising for Fortune 500 brands.
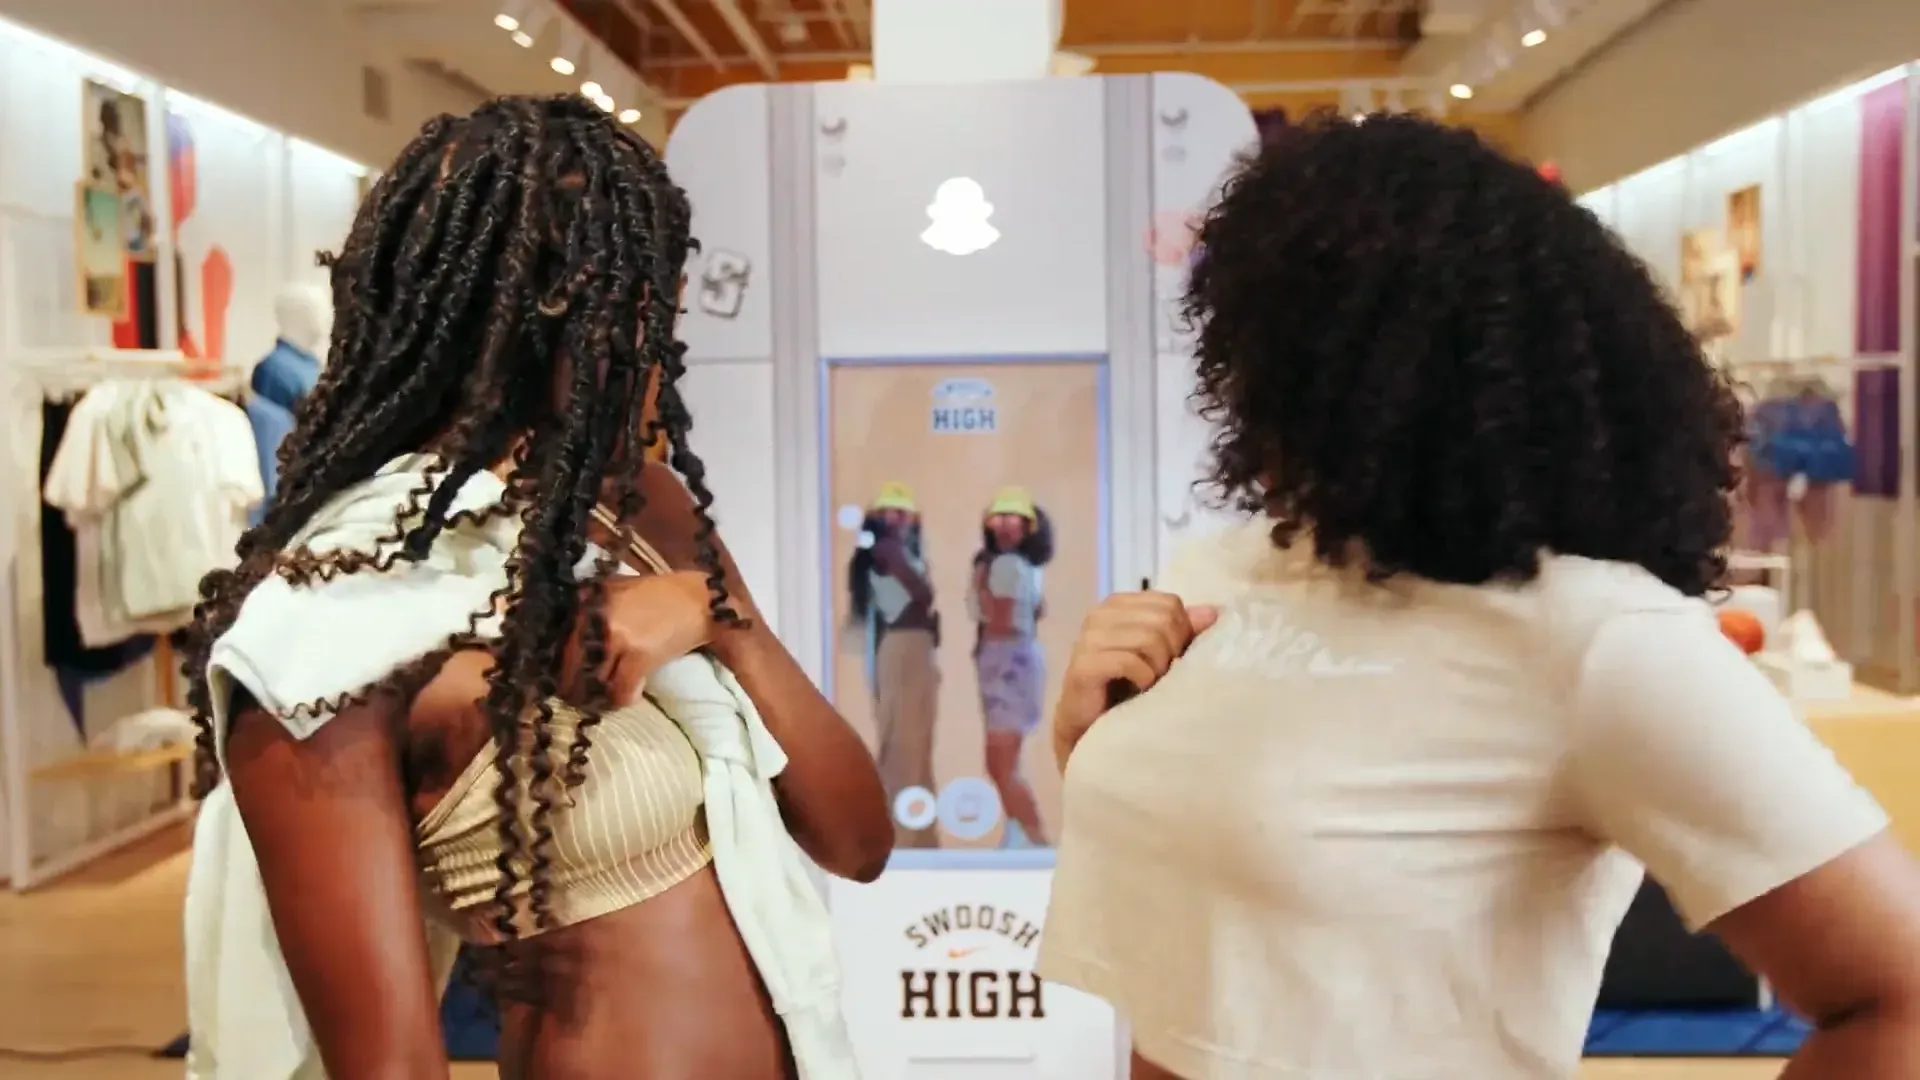
Complete guide to AR virtual try-ons in OOH Advertising—face tracking, AR mirrors & QR scans—with ROI benchmarks and case studies for Fortune 500 marketers.

Discover how U.S. zoos use Augmented Reality to boost visitor engagement, education, and revenue.

Discover the 8 best AR stocks for 2025. Meta up 50%, Unity up 130%, NVIDIA up 68%. Complete analysis shows potential 150%+ returns by 2030. Investment guide inside.